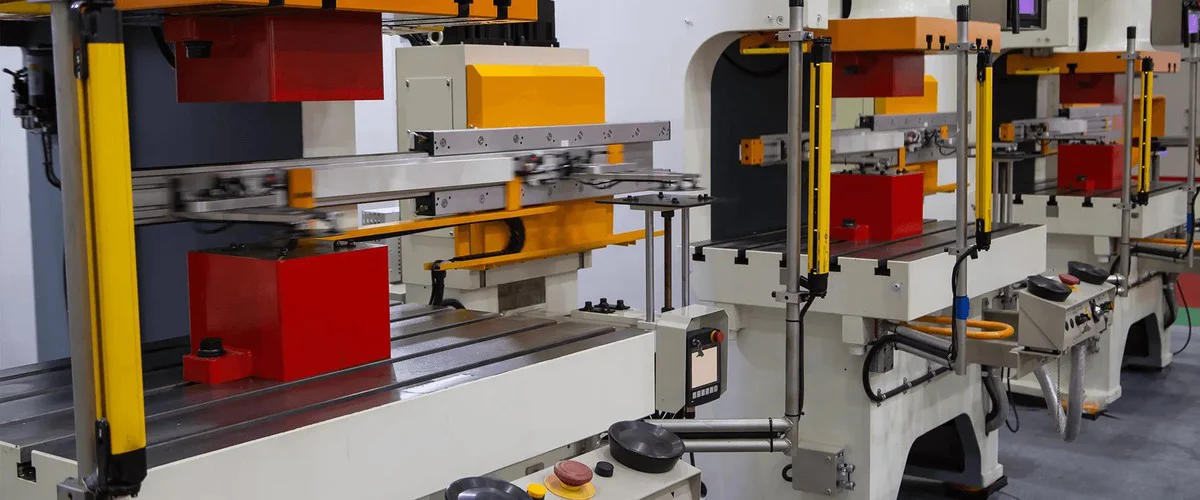
Utilisation rate is the share of planned production time that a machine is really producing. The formula is "actual run time ÷ planned production time × 100%". Utilisation rate looks only at time; OEE multiplies in speed and quality, so all three are considered together.
Factory managers often ask: "What is our utilisation rate, exactly?" "Why does the report show a utilisation rate above 100%?" "Should I look at utilisation rate or OEE?" This article works through the formula step by step with a stamping press example, and also explains why hand-recorded utilisation is often inaccurate and how to collect it automatically from old machines.
How Is Utilisation Rate Calculated?
The most common utilisation rate (also called time utilisation) uses just one formula:
Utilisation rate = actual run time ÷ planned production time × 100%
- Planned production time: the time this machine is scheduled to produce. For example, an 8-hour shift minus a 1-hour lunch break gives 7 hours.
- Actual run time: planned production time minus all the time the machine stopped, such as die changes, waiting for material, breakdowns, adjustments and waiting for people.
Worked example: one shift on a stamping press
| Item | Time |
|---|---|
| Shift length | 8 hours (480 minutes) |
| Lunch break (no production scheduled) | 60 minutes |
| Planned production time | 420 minutes |
| 2 die changes | 40 minutes |
| Waiting for material, minor stops | 23 minutes |
| Actual run time | 420 − 40 − 23 = 357 minutes |
| Operation Ratio | 357 ÷ 420 = 85% |
This press was not producing for 15% of the time. To raise utilisation, you need to know where those 63 minutes went: slow die changes, waiting for material, or breakdowns.
What Is the Difference Between Utilisation Rate and OEE?
OEE (Overall Equipment Effectiveness) multiplies three numbers:
OEE = utilisation rate (time) × performance efficiency (speed) × quality rate (yield)
| Metric | Question it answers | Formula | Losses it shows |
|---|---|---|---|
| Operation Ratio | How much of the time is the machine working? | Actual run time ÷ planned production time | Die changes, waiting for material, breakdowns, adjustments |
| Performance efficiency | When it is working, is it fast enough? | Actual output ÷ (actual run time × standard speed) | Idling, minor stops, running at reduced speed |
| Quality rate | How many of the parts made are good? | Good parts ÷ actual output | Defects, rework, trial parts during start-up and adjustment |
| OEE | How much did the machine deliver overall? | Multiply the three | All of the above |
In short: a high utilisation rate does not mean much was made, or made well. A machine that is on all the time but runs slowly and produces many defects still shows a good utilisation rate. Only OEE reveals the problem.
How to Calculate OEE: Using the Same Stamping Press
Continuing the example above, this press has a standard speed of 30 parts per minute:
- Utilisation rate: 357 ÷ 420 = 85%
- Performance efficiency: in 357 minutes at standard speed it could make 357 × 30 = 10,710 parts, and it actually made 8,568. 8,568 ÷ 10,710 = 80%
- Quality rate: of the 8,568 parts, 8,140 were good. 8,140 ÷ 8,568 ≈ 95%
- OEE:85% × 80% × 95% ≈ 64.6%
For the same machine, a utilisation rate of 85% looks good, but OEE is only about 65%. The gap comes mainly from performance efficiency: while the machine was running, one fifth of its speed was lost, possibly to minor stops, poor feeding or deliberately reduced speed. This is why looking at utilisation alone is not enough.
Why Does Utilisation Rate Go Over 100%?
By the formula above, utilisation cannot exceed 100%. If a report shows more than 100%, the numerator and denominator are usually calculated differently:
- The denominator uses "shift time" but the machine ran overtime: planned 8 hours but actually ran 9 hours, so the result exceeds 100%. Overtime should also be counted in planned production time.
- Utilisation calculated as "output ÷ standard capacity": some factories calculate utilisation as actual output ÷ standard capacity. If the standard speed is set too conservatively and the machine actually runs faster, the result goes above 100%. This is really closer to performance efficiency, and the standard speed should be reviewed.
- One person minding several machines, or several shifts added together: the numerator adds up the time of several machines or shifts, while the denominator uses only one machine or one shift.
When you see more than 100%, first write down the formula: what time is in the numerator, what time is in the denominator, and where each comes from. Use one method throughout a factory so production lines can be compared.
Is a Higher Utilisation Rate Always Better?
Not necessarily. A high utilisation rate means the machine rarely stops, but if there are not enough orders, forcing it to keep running only piles up inventory and ties up material and warehouse space. A more practical view is:
- When production is needed, can the machine start at any time? Breakdowns and slow die changes should be improved, and the less of them the better.
- When there are no orders, stopping is normal: there is no need to produce just to make the numbers look good.
- The trend matters more than a single number: is this month higher or lower than last month for the same machine, and are the reasons for stoppage decreasing?
Utilisation Rate, Availability, Capacity Utilisation: Terms That Are Often Mixed Up
| Name | Usual meaning | Note |
|---|---|---|
| Utilisation rate (time utilisation) | Actual run time ÷ planned production time | The most common term in Taiwanese factories |
| Availability (operability) | The share of time a machine can run when it is needed, looking at being unable to run because of breakdowns or die changes | Japanese factories often talk about this separately from utilisation rate; the closer to 100%, the better |
| Capacity utilisation | Actual output ÷ maximum capacity | Often used in business and economic reports, and different from shop-floor utilisation rate |
| OEE (Overall Equipment Effectiveness) | Utilisation rate × performance efficiency × quality rate | Looks at time, speed and quality together |
The same term may be calculated differently in different factories. When comparing numbers with customers, a parent company or consultants, first confirm the other side's formula.
Why Is Manually Recorded Utilisation Often Inaccurate?
- Stop times are filled in from memory: forms are completed just before leaving work, and stops of a few minutes are simply not recorded.
- Output is estimated by eye or counted afterwards: quantity and time do not match, so performance efficiency cannot be calculated.
- Everyone records differently: whether a die change counts as a stoppage, or whether lunch is deducted, is written differently by different shifts.
- Data is compiled at month end: nobody knows when a problem happens, and by the time the report is out several weeks have passed.
To make utilisation rate and OEE truly useful, the key is to let the machine record every cycle itself.
How Do You Collect Utilisation Data Automatically from Old Machines?
Many factories have stamping presses, injection moulding machines and packaging machines that have been used for over ten years. They have no network interface, and replacing them is not cost-effective. Utilization Fairy is a machine utilisation monitoring system developed in-house by YenProtek that needs no machine modification and can be added to old machines:
- No line stoppage, no machine modification: add a control box with a built-in counter and communication module next to the machine. It works on new and old machines of different brands.
- Every cycle is uploaded automatically: each count is uploaded to the cloud automatically, so there is no need for hand-written records.
- Utilisation rate and OEE calculated automatically: the system counts output and calculates utilisation rate, and can also calculate OEE. You can view it on a computer, tablet or phone.
- Stop reasons and history: live machine status, production progress, work orders, stop-reason analysis, historical production records and trend charts are all on one platform.
Implementation example: a stamping plant in Taichung had mostly older machines that could not be networked, of different brands. They wanted to collect the production status and utilisation of every machine without modifying them and with quick installation. YenProtek added control boxes to monitor utilisation across the whole factory. For details, see Stamping Industry Utilisation Monitoring Case.
If you also need to collect values from gauges and meters, you can pair it with Monitor-Fairy, which reads meters automatically by image recognition, with no need to remove the meter or modify the machine.
How to Estimate the Cost
The cost depends mainly on how many machines to connect, how the site connects to the internet, and whether you need to integrate with existing systems. You can first go to the Utilization Fairy online quote, choose the number of machines and see an approximate cost. If you have many machine types or need to connect to MES or ERP, feel free to contact us and we will assess your site.
Frequently Asked Questions
Q1: What is the formula for utilisation rate?
Utilisation rate = actual run time ÷ planned production time × 100%. Planned production time is the time scheduled for production. Actual run time is the time the machine is really working after subtracting stoppages such as die changes, waiting for material and breakdowns.
Q2: What is the difference between utilisation rate and OEE?
Utilisation rate looks only at time. OEE is utilisation rate × performance efficiency × quality rate, so it looks at time, speed and quality together. A machine with high utilisation but slow speed and many defects will still have a low OEE.
Q3: Can utilisation rate be over 100%?
Not under the standard formula. A figure above 100% usually means overtime was left out of the denominator, or "output ÷ standard capacity" was used as utilisation with the standard speed set too low. Agree on one way of calculating first.
Q4: What is a good OEE?
It varies a lot by industry and machine type, and there is no single number that fits every factory. A more practical approach is to calculate your own OEE correctly, see which loss is largest, and track month by month whether it improves.
Q5: Can utilisation be collected automatically from old machines with no network connection?
Yes. Utilization Fairy adds a control box with a built-in counter and communication module next to the machine. The line does not stop and the machine is not modified. Every cycle is uploaded to the cloud automatically, and utilisation rate and OEE are calculated for you.
Q6: Can it connect to our existing MES or ERP?
Yes, data integration is available. Tell us the name of your system and the data you want to connect, and we will assess it case by case.