You only know pests are heavy when fruit drops
How the daily trap catch changes reveals rising pest numbers earlier than any single day's number. The system tallies it daily and compares it with the past 7-day baseline.
Cloud Management Systems | New release

Pest pressure you can see,
a pre-harvest interval you can calculate.
Traps count automatically, so you know first when pest numbers rise. The system works out what you applied and when you can harvest, and blocks you when it is too early.
The Pest & Disease Management System is a cloud system developed by YenProtek with technology transferred from a leading Taiwanese university. It connects fruit fly trap monitoring, field weather, plant doctor diagnosis and pesticide pre-harvest interval (PHI) management. If the PHI has not ended, the harvest entry is blocked.
Why pest control in orchards is always a step behind
How the daily trap catch changes reveals rising pest numbers earlier than any single day's number. The system tallies it daily and compares it with the past 7-day baseline.
The system checks the crop and target pest against the pesticide's registered use range. If they are outside the range, it warns you first, and then you decide whether to log the application.
You would have to look up and calculate the pre-harvest interval yourself. The system calculates the earliest harvest date from the pesticide use record, and harvest cannot be logged before then.
Function
Trap counts upload automatically, reports and diagnosis run in the same case, and pesticide use is checked against registration data. The pre-harvest interval is calculated and enforced.
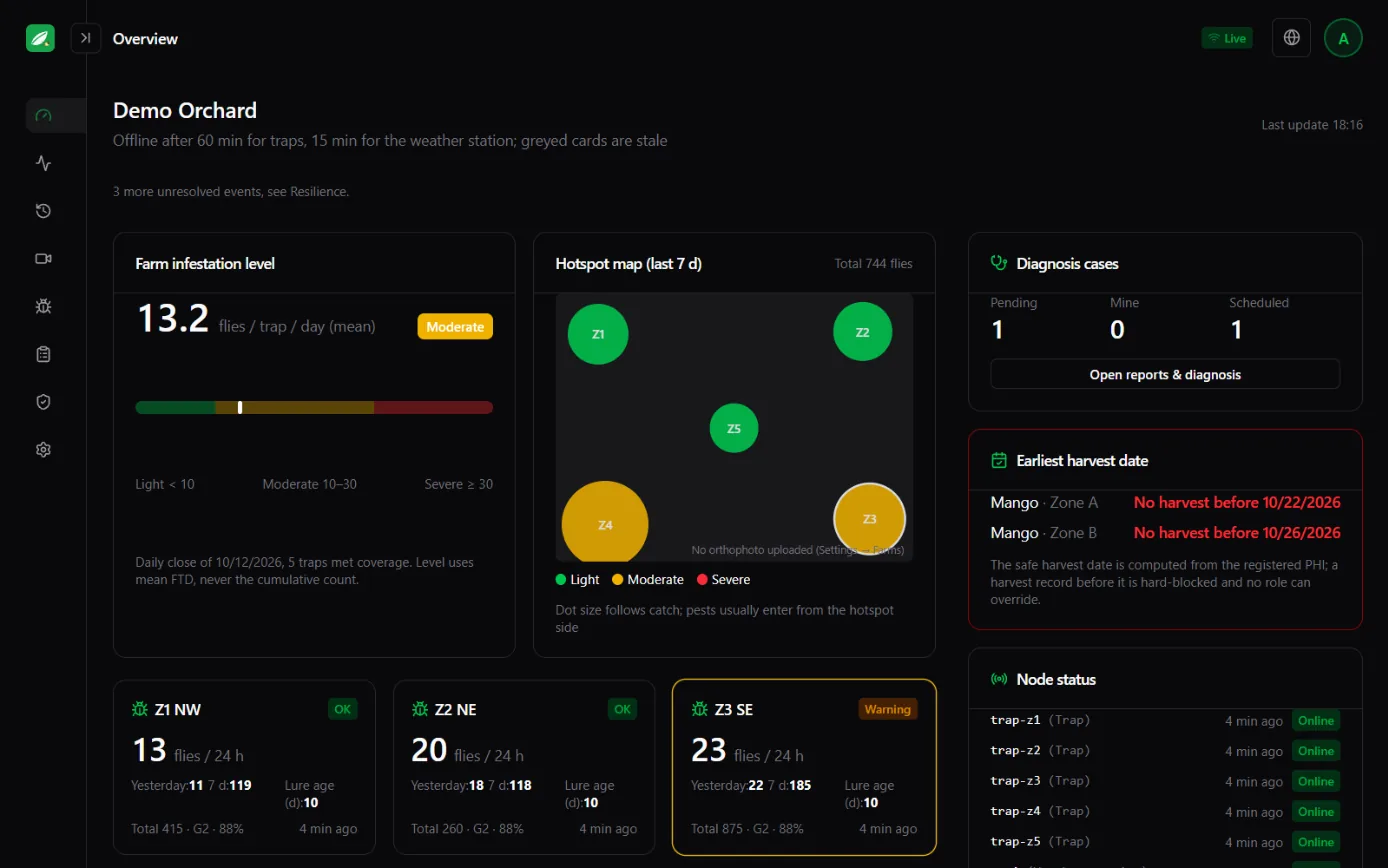
Trap catch from each trap site uploads automatically. Farm-wide pest severity is read as "flies per trap per day (FTD)" and the size of the increase is compared with the past 7-day baseline. Lure age and replacement deadlines and node status are on the same page.
Farmers report with a phone photo. The photo's GPS fills in the location automatically, and the system attaches that day's weather summary. A plant doctor accepts the case, schedules a field visit and issues the diagnosis report. After the case is closed, it can no longer be edited.
Daily FTD bars with the past 7-day baseline; the dates of lure changes and equipment changes are marked on the chart, so values before and after are not compared by mistake. The farm-wide daily summary, daily tables by trap site and events can be downloaded as CSV.
Scan the barcode on the bottle to look up the registration number, active ingredient, registered use range and PHI. When you log an application, the crop, target pest, application interval and number of applications are checked, and the earliest harvest date is calculated.
Live view from orchard cameras, available right after login. When there is no signal, the last frame is shown.
Node offline, abnormal counts, expired lures, favorable outbreak conditions, overdue cases and unregistered use all open events, graded as notice, warning or critical, with a handling method you can record. Thresholds have global defaults, and each site can override them.
How It Works
Trap sites upload cumulative trap catch to the cloud, which is tallied daily into flies per trap per day (FTD), compared with the past 7-day baseline, graded and pushed to the screen.
Trap catch is an index of male fly density, so read the trend rather than a single point. Values after a lure change or equipment change are not compared directly with earlier values.
Trap site layout
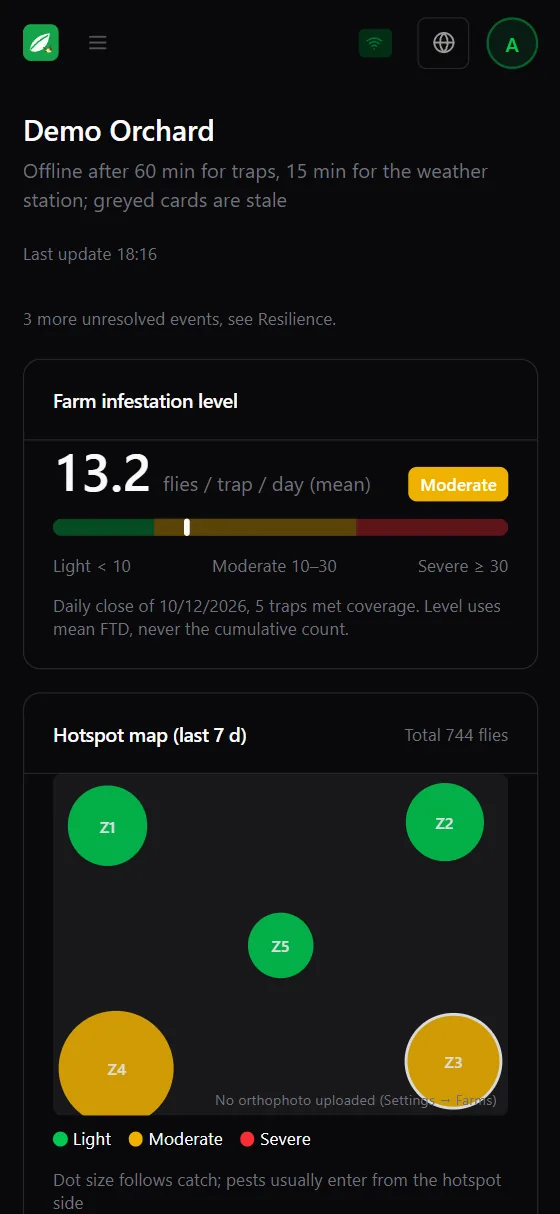
The basic site setup uses five trap sites: four corners and the center (Z1 to Z5). Trap catch is recorded separately for each site and compared with the baseline separately. Together with the hotspot map, you can see which direction the pests come from.
System Screens

Actual system screen; data is sample data for demonstration
As soon as you open it, you see farm-wide pest severity, the trap catch of each trap site and its rate of change against the baseline. The hotspot map, weather station summary and diagnosis cases are on the same page.

Actual system screen; data is sample data for demonstration
Flies per trap per day (FTD) is drawn as daily bars overlaid with the past 7-day baseline, so the size of the increase is clear at a glance. The dates of lure changes and equipment changes are marked on the chart.

Actual system screen; data is sample data for demonstration
A progress bar runs from reported, accepted and diagnosed to closed. Report details, site photos, weather summary, field visit booking and the diagnosis report are all on one page, with a verification hash attached after closing.

Actual system screen; data is sample data for demonstration
Each application entry records the crop, target pest, material, amount and application method. The system checks the registered use range and calculates the earliest harvest date, and entries outside the range are flagged.

Actual system screen; data is sample data for demonstration
Log the harvest date, quantity and destination. If the PHI has not ended, the screen tells you before which date you cannot harvest, and submission is blocked.
Pre-harvest interval (PHI)
When you log a pesticide application, the system checks the pesticide registration data for the PHI of this pesticide on this crop and calculates the earliest harvest date. Harvest entries before that date are blocked, and no role can override it.
If the crop or target pest is not in the pesticide's registered use range, you must confirm again before submitting. Your confirmation is recorded and the plant doctor is notified.
If the application interval is too short or the registered number of applications is exceeded, you are warned right when you log it.
Pesticides whose registration has been revoked are marked in the master file, and you cannot log an application with them.
When the PHI cannot be found in the pesticide master file, the system does not let it through. It blocks harvest using the conservative number of days set by the administrator. This website does not list the days for any pesticide; the pesticide registration data is the reference.
Roles and workflow
Accounts are created by administrators; self-registration is not available. Plant doctors and farmers are parallel roles, and farmers only see the sites they have joined.
Attach at least one site photo and describe the damage. The photo's GPS fills in the location automatically, and the system attaches the weather summary for the report date.
Accept the case after being notified; administrators can also assign a plant doctor from the queue of pending cases. Cases not accepted in time escalate with reminders.
The plant doctor proposes visit time slots, and the farmer confirms to schedule the visit. Unconfirmed bookings are flagged.
Pest or disease name, diagnosis, recommended control measures and recommended materials (which can be pulled from the pesticide master file), amount and dilution ratio.
After closing, the entire case (including photos and notes) can no longer be edited, and the content hash can be checked by third parties. If a follow-up diagnosis is needed, open a new case.
Getting started
Orchard name, main crops, area and map coordinates. Upload a layout map or orthophoto to give the hotspot map a base map.
The administrator registers nodes first; only then do trap sites and weather stations start uploading data.
Farmers join the site and the cooperating plant doctor is designated; each person logs in in their own language.
Calibrate trap thresholds and lure replacement cycles for the crop and season, then check trends daily, report with photos, and log pesticide use and harvests.
Platform
Just open it in a browser; no installation needed. You can also add it to your phone's home screen and open it like an app.
Each user chooses their own interface language.
It follows the device setting or can be switched manually, so the screen is easy on the eyes on night rounds.
Each role can view and edit a different scope. Accounts are created by administrators and self-registration is not available. When someone leaves or is replaced, the account is deactivated.
Sensor data and events are pushed to the screen with no need to refresh. Connection status is always visible, and disconnections are flagged.
Every change to thresholds and important data is recorded, so there is a basis for audits.
Compatible Hardware
The field weather station, trap counters and cameras are all YenProtek's own products.
Traps count catches automatically and upload the data, and cameras provide live field video. Traps are placed at the four corners plus the center.
Four things: pest monitoring, where traps count automatically and results are compared with the past 7-day baseline; field weather with prompts for conditions that favor outbreaks; a case workflow for farmer photo reports and plant doctor diagnosis; and pesticide use records checked against registered use ranges, with harvests blocked until the PHI ends.
No. Trap catch reflects male fly density and is used to read trends. The system compares the average number of flies per trap per day with the past 7-day baseline, and the size of the increase matters more than a single day's number. Values after a lure change or equipment change cannot be compared directly with earlier values, and the system marks these on the chart.
FTD is the average number of flies caught per trap per day. The system grades pest severity (notice, warning, critical) by the farm-wide average FTD rather than the cumulative total count. Thresholds are calibrated by a plant doctor for the site, season and crop.
Field weather is measured by FarmerPack, and the trap counters and cameras are YenProtek's own products. Traps are placed at the four corners plus the center, and the number of traps is planned according to orchard size.
The pre-harvest interval (PHI) is the number of days to wait between the last pesticide application and harvest, set for each crop based on pesticide registration data. The system adds this number of days to the application date to get the earliest harvest date, and harvest entries before that date are blocked. For pesticides whose PHI cannot be found, harvest is blocked using a conservative number of days.
The system flags it as "outside registered use range," and you must confirm again before submitting. After confirmation, your confirmation is recorded and the plant doctor is notified. The system records what has already happened but does not encourage off-label use.
No. Until the PHI ends, no role can log a harvest, administrators included. For pesticides whose PHI cannot be found, harvest is also blocked using a conservative number of days.
Once a case is closed, the entire case, including photos and notes, can no longer be edited, and a content hash is provided so you can verify it has not been altered. If a follow-up diagnosis is needed, open a new case.
No. Just open it in a browser. You can also add it to your phone's home screen and open it like an app. On a phone, you can take photos to report and scan pesticide barcodes directly.
Yes. The interface is available in six languages: Traditional Chinese, English, Japanese, Thai, Vietnamese and Malay. Trap monitoring, field weather and the report-and-diagnosis workflow work anywhere. The pesticide database currently supports Taiwan registration data; other markets need localization, so please contact us first.
Yes, you can book an online demo. We will walk you through every screen using a demo system (the demo data is fictional sample data). Tell us about your crops, the number of orchards and your trap layout, and we will look at suitable settings together.
Start by going through every screen in the demo system, then decide together how to lay out the trap sites and who needs to join.


