Overfeeding
Leftover feed makes water quality worse. 5 minutes after feeding, the system asks you to log whether any feed was left over, so you know how much to feed next time.
Cloud Management Systems | New release

Water quality you can see,
a system you can keep alive.
See water level, water temperature and fish activity at any time. The system keeps track of whether you have fed and whether it is time to test the water.
The Aquaponics Monitoring System is a cloud system developed by YenProtek with technology transferred from a leading Taiwanese university. It combines sensing, live video and remote feeding, and brings manual water tests into the same record, to help you judge whether your system is healthy.
Why aquaponics systems so often fail
Leftover feed makes water quality worse. 5 minutes after feeding, the system asks you to log whether any feed was left over, so you know how much to feed next time.
A new system needs frequent testing, which can be relaxed once it stabilizes, but it is easy to forget. The system reminds you which test is due and when, based on the system stage.
If the top-up tank runs empty or the water level drops, you will not know when you are not on site. The status of the grow beds, fish tank and top-up tank is always visible.
Function
Real-time sensor push notifications, event evaluation based on consecutive readings, and remote feeding with duplicate-feeding protection. Manual water tests are the main basis for judging system health.
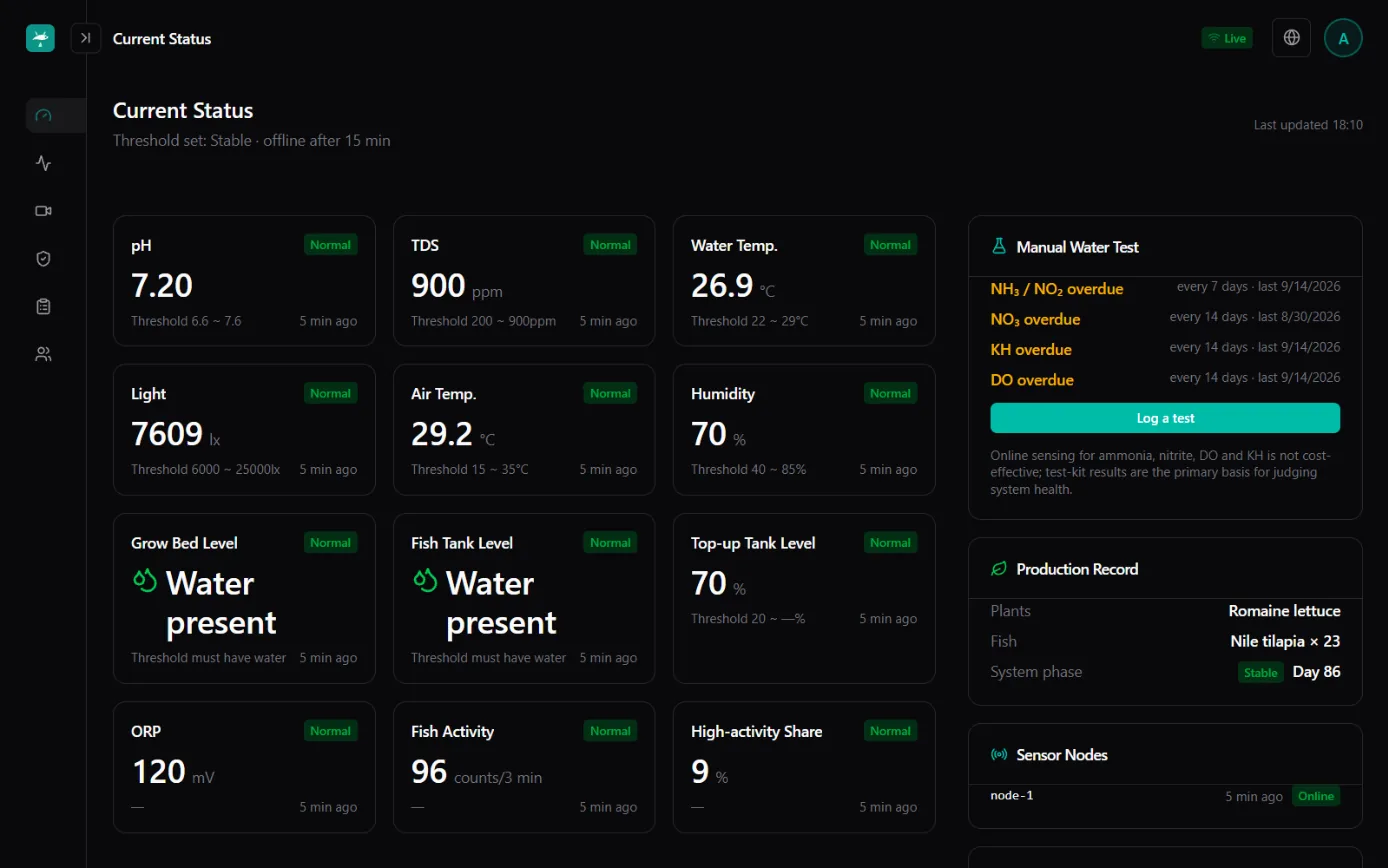
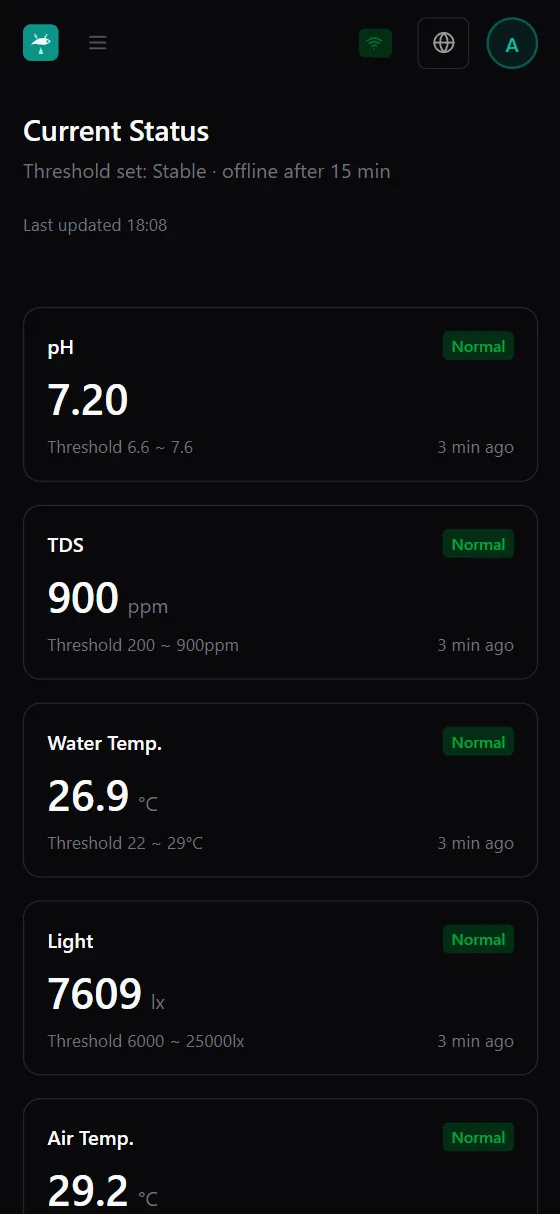
pH, TDS, ORP, water temperature, light level, air temperature, humidity, grow bed and fish tank water levels, top-up tank water level and fish activity are all on one page. Each card shows its threshold and status, and outdated data is marked.
Watch the fish tank directly on your phone with low-latency streaming. Enter a feed amount to feed remotely, and if the fish were just fed, the system asks whether you really want to feed again.
Trend charts for 24 hours, 7 days, 30 days or a custom range, with the safe range shown as a color band. Beyond 7 days, charts switch to hourly summaries automatically.
An alert is sent only after several consecutive readings are out of range, and recovery has a buffer too. Each metric can have upper and lower limits, a rate of change and an observation period, or can be set to record only without alerting.
Water tests, feeding, water changes, planting, fish and farming history are all in one place and can be exported as CSV.
How It Works
Sensor nodes and cameras send data to the cloud, which evaluates it against thresholds in consecutive readings and pushes notifications to your phone. The cloud also issues commands for lighting, top-up, aeration and feeding, with safety interlocks that block actions that should not run.
System stage
In a new system, the nitrifying bacteria have not fully established, so high ammonia and nitrite are normal. The system switches threshold sets and testing frequency based on operating days, so it does not alert nonstop from the beginning.
Days and frequencies are system defaults and can be adjusted for fish species and your site's history.
System Screens

Actual system screen; data is sample data for demonstration
As soon as you open it, you see each metric's current value, threshold and status, and on the right the due status of manual tests and the farming history.

Actual system screen; data is sample data for demonstration
Pick a metric and a time range. The safe range is drawn as a band on the chart, so periods out of range are easy to spot.

Actual system screen; data is sample data for demonstration
See on one page how many events occurred in the past 30 days, how long they took to clear on average and which metric causes the most problems. You can write down the action taken for every event.

Actual system screen; data is sample data for demonstration
Log ammonia, nitrite, nitrate, dissolved oxygen and carbonate hardness, and the system marks each as safe, caution or danger based on the safe range. Feeding, water changes, planting, fish and farming history are here too.
Manual testing
Log ammonia, nitrite, nitrate, dissolved oxygen, carbonate hardness and test-kit pH. The system marks each as safe, caution or danger based on built-in safe ranges, and a dangerous value automatically opens an event.
The home page lists the test interval and last test date for each item, and overdue items are flagged directly.
Enter the test value and the person who tested, and optionally note the test-kit brand and remarks.
Each item is marked according to its safe range. A dangerous value opens an event, and the handling is kept in the event history.
Ranges are system defaults and can be adjusted for the farmed species and your site's history. This website does not list values; the threshold table in the system is the reference.
Roles and workflow
Accounts are created by administrators; self-registration is not available. Feeding and equipment operation require administrator permission.
Getting started
Your fish tank, grow bed and top-up tank layout, and what you want to see.
Install the sensor nodes, cameras and the equipment to be controlled according to your site layout.
The administrator creates member accounts and adjusts thresholds and testing frequency for the fish species and crops.
When something is abnormal, open the system to view events and video, then mark them as handled once resolved.
Platform
Just open it in a browser; no installation needed. You can also add it to your phone's home screen and open it like an app.
Each user chooses their own interface language.
It follows the device setting or can be switched manually, so the screen is easy on the eyes on night rounds.
Each role can view and edit a different scope. Accounts are created by administrators and self-registration is not available. When someone leaves or is replaced, the account is deactivated.
Sensor data and events are pushed to the screen with no need to refresh. Connection status is always visible, and disconnections are flagged.
Every change to thresholds and important data is recorded, so there is a basis for audits.
Compatible Hardware
Water quality, environment and equipment control all use YenProtek's own products, from sensing to remote switching in one package.
Sensor nodes continuously measure water temperature, light level, air temperature, humidity, TDS, ORP, grow bed and fish tank water levels, top-up tank water level and fish activity. Ammonia, nitrite, nitrate, dissolved oxygen, carbonate hardness and test-kit pH are tested manually and logged, and the system flags the risk level of each result.
The system treats test-kit results as the main basis for judging whether the system is healthy. It reminds you how often to test based on the system stage, and only when a test is overdue, so you do not need to test every day.
By default, days 0 to 42 are the cycling period. During this time, high ammonia and nitrite are normal, so the system uses a separate set of thresholds and does not alert constantly from the start. By default, it reminds you to test ammonia and nitrite every 2 days in the cycling period and every 7 days in the stable period. These are system defaults and can be adjusted for your site.
Yes. Administrators can enter a feed amount on their phone to feed remotely. Before feeding, the system shows the time of the last feeding and asks you to confirm, to prevent duplicate feeding. When a sensor node is offline, the feeding function is disabled, and a command expires after 10 minutes.
Logging whether any feed is left over 5 minutes after feeding is the basis for adjusting the feed amount, because overfeeding is one of the most common reasons aquaponics systems fail.
Yes. The grow light turns on only within the set time window, before the daily hour target is reached, and when light is below the lower limit. Water is never topped up when water is low or the top-up tank is empty, and automatic top-up runs at most 3 times a day (system default).
No. An alert is triggered only when several consecutive readings are out of range, and clearing has a buffer as well, so a single spike does not trigger an alert. Each metric has adjustable thresholds, or can be set to record only without alerting.
Water quality is measured by AquaPack, while air temperature, humidity and light level are measured by FarmerPack. The grow light, top-up pump, aerator and feeder are switched by the Smart Control Box. Cameras and layout are planned to fit your site.
Six languages: Traditional Chinese, English, Japanese, Thai, Vietnamese and Malay. It also supports dark mode and can be added to your phone's home screen.
Yes, you can book an online demo. We will walk you through every screen using a demo system (the demo data is fictional sample data). Tell us how your fish tank, grow beds and top-up tank are set up, and we will look at suitable settings together.
Same series
From home tanks to school demonstration sites, start by going through every screen in the demo system, then decide together which sensors and equipment to install.


